Chinatown Neighborhood Survey Complete

The most recent Chinatown Neighborhood Survey, which began on September 17, 2016, ended on January 16, 2017. The survey covered a total of 1,007 addresses randomly selected from the 1,901 addresses in the Chinatown neighborhood, which was defined as the blocks between 8th and 13th, Spring Garden and Filbert. We received 163 responses for a response rate of 16.2%.
PCDC would like to thank the volunteers who committed their time to make sure residents had a chance to participate in the neighborhood planning process. Thank You: Yuki Huang, Faustina Lee, Wendy Lee, Zoe Wu, Lamei Zhang, Yanjun Zheng, and Zhicheng Zheng, as well as the students from First Baptist Academy, Dallas, Texas.
PCDC would also like to thank those who took the time to complete the survey and provide feedback on the direction of Chinatown development. The raw data is currently being processed and analyzed to create a Chinatown Neighborhood Plan for the upcoming 5 years that will address the issues most important to Chinatown residents.
In the meantime, preliminary results give a general sense of the state of Chinatown in 2016:
Graphs 1&2: Survey Sample Address Type and Percent Completion
More than half of the randomly drawn sample of addresses were located in condos or high rises, units that are not directly accessible to surveyors and could only be reached by mail. Philadelphia Chinatown, particularly Chinatown North, has seen a significant surge in luxury condo and apartment developments catering to business professionals who work in Center City. This new population, which is significantly wealthier than the existing community, may not feel as connected to community organizations and amenities. This disconnect may affect the social fabric of Chinatown. However, multifamily units do not themselves guarantee community disconnect.
[one_half]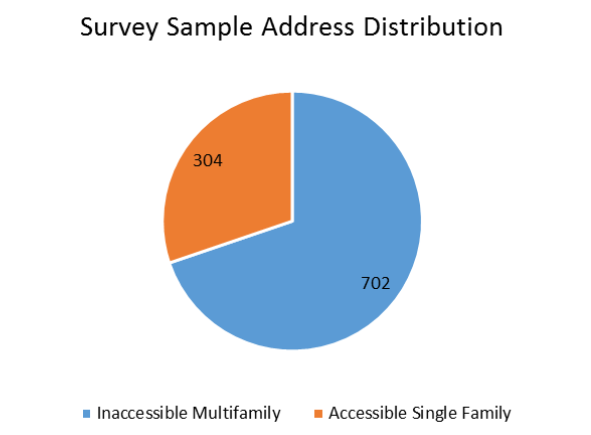 [/one_half][one_half_last]
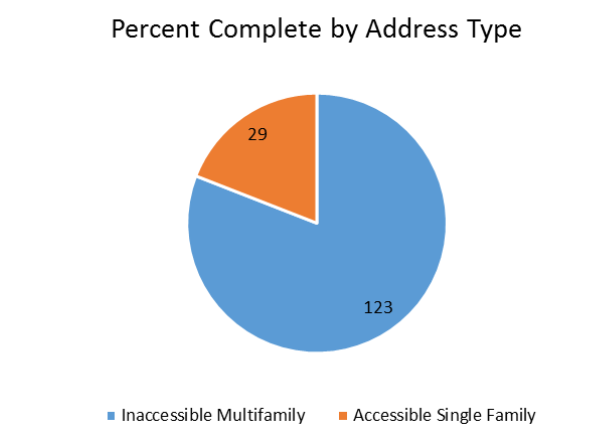 [/one_half_last]
Graph 3: Percent Completion by Address
The best turnout rates, from 810 Arch, Dynasty Court, Hing Wah Yuen, and On Lok House, were PCDC developments whose residents are
actively engaged in our programs and services.
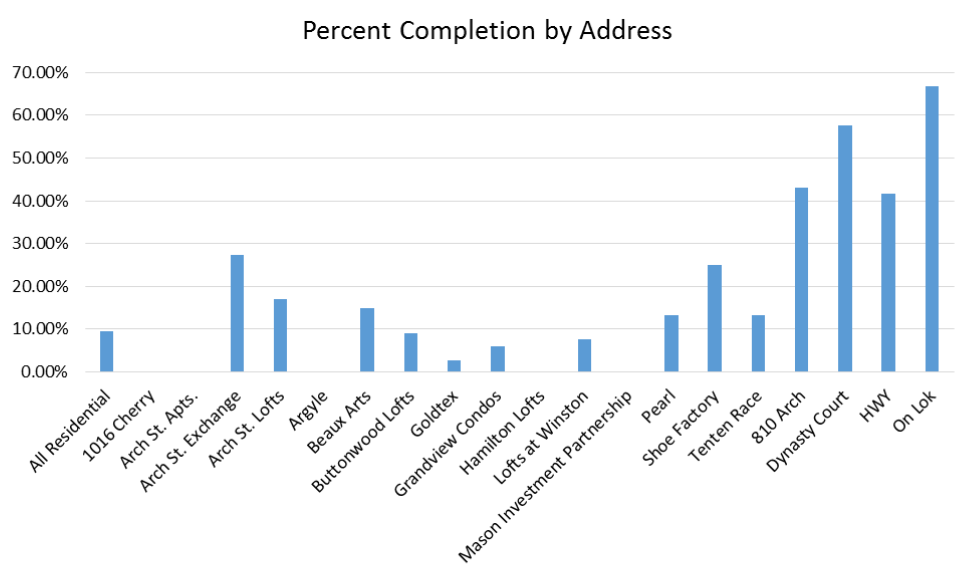
Table 4: Percent of Monthly Income Spent on Housing Expenses
Rising housing costs are a significant concern in Chinatown, as new developments threaten to price out the low-to-moderate-income long-term households that run Chinatown’s businesses, the backbone of Chinatown’s community. With the exception of the extremely low-income, residents of the affordable housing developments and senior homes, the low-to-moderate income households are rent-burdened, spending over 33% of their monthly income on housing expenses.
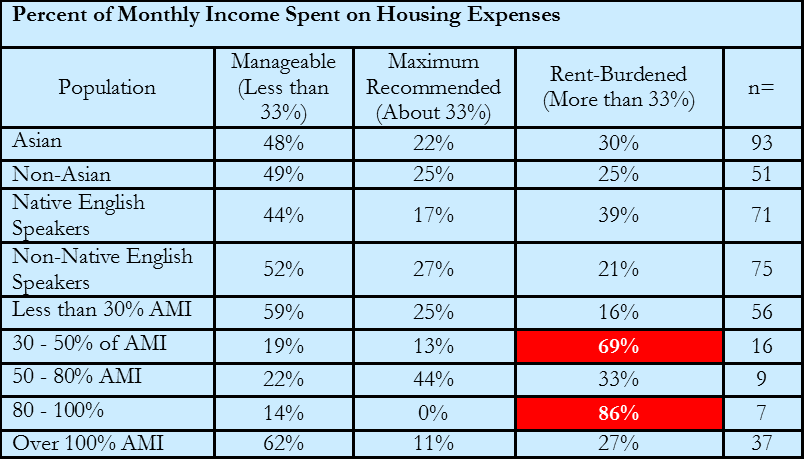
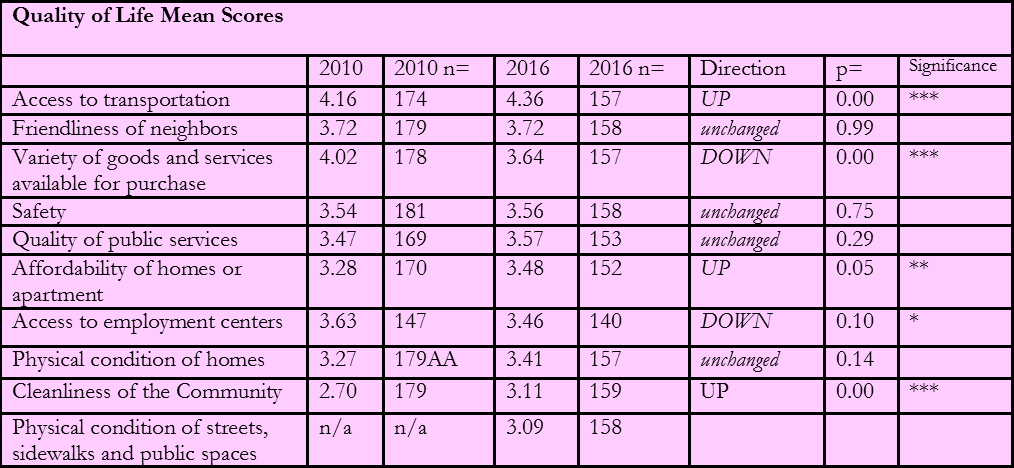
Table 5. Quality of Life Mean Scores
Note: *** indicates difference is statistically significant at p<0.01; ** indicates difference is statistically significant at p<0.05; * indicates difference is statistically significant at p<0.1
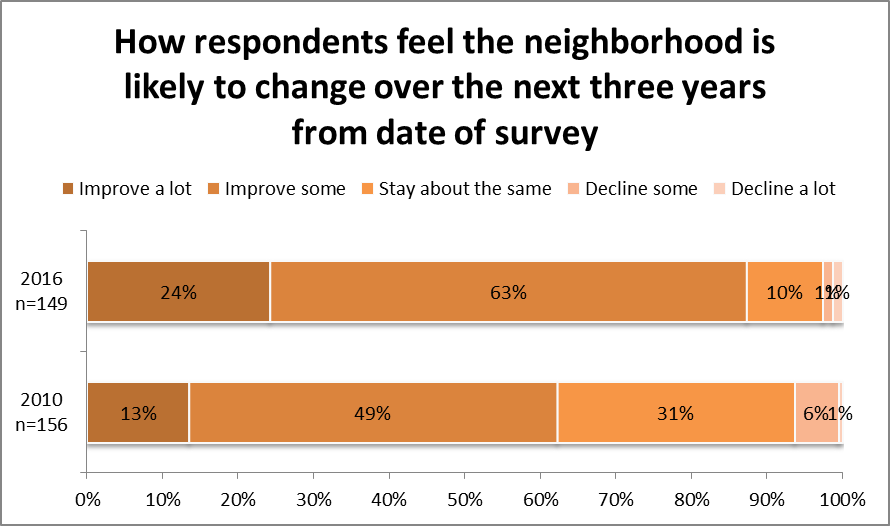
Graph 6. How respondents feel the neighborhood is likely to change over the next three years from the date of the survey
Please stay tuned for the Chinatown Neighborhood Plan analysis on other community concerns such as access to amenities, cleanliness, safety, and sense of community.